1 VISIBILITY
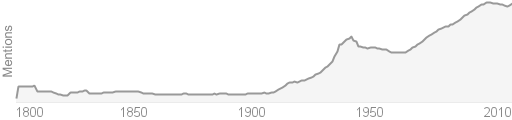
The use of the word “Visibility” over time;
As systems get larger and more complex and more automated, there is a growing trend to see results or key indicators, that will give us a hint as to whether the investment was worth it and what exactly is going on inside that huge data repository that seems to be a black box of important information. It can be compared to mining for gold.
We strive for information systems that make our day-to-day jobs simpler and more transparent, and in most cases, we are faced with the complete opposite. It was this frustration with system and process that forces many of our customers to ask the question: Is there a way we can expose the inner workings and hidden process information in a simple, fast manner that adds real value as quickly as possible without burning a hole in one’s pocket?
Most reporting or information gathering exercises start with a long drawn-out discovery phase, and then a technology evaluation phase, and then a build and rework phase until the report delivers information that we realise was not what we were looking for in the first place.
A better approach is to – firstly breaking up the problem into manageable chunks significantly reduced the size of the problem mountain. Using their supply chain experience and knowledge of the warehouse as well as identifying the hot spots in the warehouse, we can ask ourselves the following questions:
- What are the pickers doing to fill their time, and what fills their time?
- What is the pick rate of the pickers throughout the day, and how many times are pickers visiting bins?
- How many cases are typically being picked in a picker’s work shift?
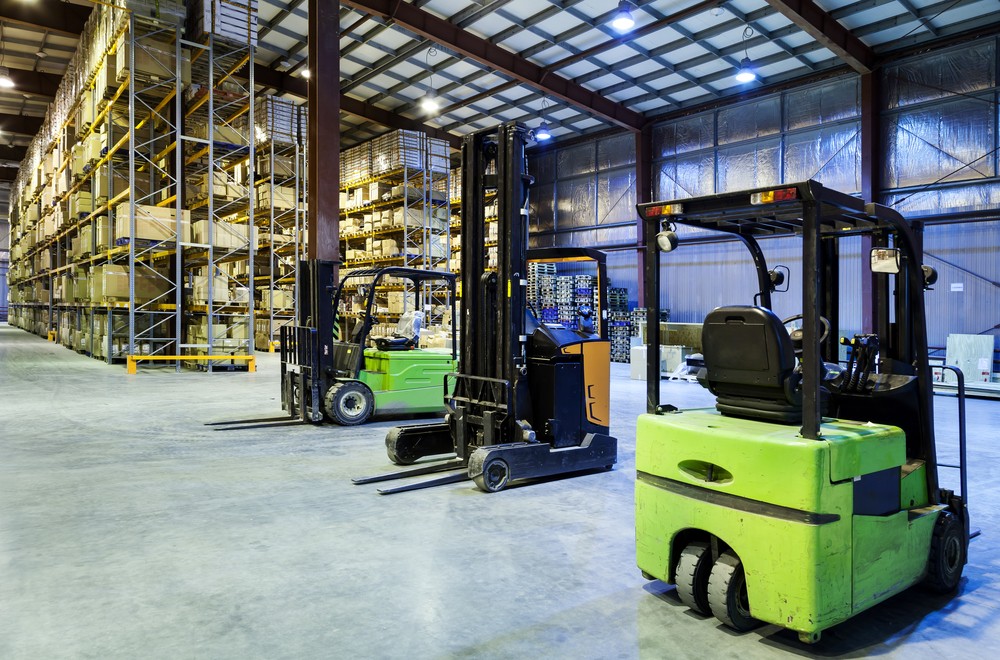
Picking is at the heart of the warehouse operation. It is a focal point where all the receiving, replenishment and planning issues manifest themselves. Let’s start at pick face picking and work outward to the source of the problem.
The process is now significantly accelerated, by avoiding the traditional trap of being distracted by the long drawn out analysis of demand patterns, receiving issues and stock on hand, following this approach realises results significantly faster.
Traditional reporting or data analysis projects that are faced with this amount of data, have another formidable obstacle to overcome, and this is what technology to throw at the problem? By categorising the data relevance into categories such as real time or trend data, simplifies the selection of the technology significantly.
Another factor to be considered would be whether the report needs to be displayed in real time, updated by the minute, or whether it is trend type data that can be extracted and analysed over time? Additionally, would the users like to manipulate, or mine for the data in a format they would understand?
Here again the decision should be made: First SAP technology and if not SAP, why not? In the case and many future cases SAP’s recommended reporting platform will be Fiori for the rendering portion of the application. It allowed real time, as well as trend type reports, which allowed the user to manipulate or drill down into the information.
As part of any technology selection, we need to make sure there are people that can configure and work with the technology, in other words, we found the car but still needed to find a driver. Fiori resources are becoming available more and more each day, resources that are eager to show the power of this versatile reporting environment.
The results were astounding, and very surprising. Here are some reports produced in a very short time.
Keeping with the theme of simplicity and Visibility, a dashboard is always a good idea to make access to these reports as simple as possible.
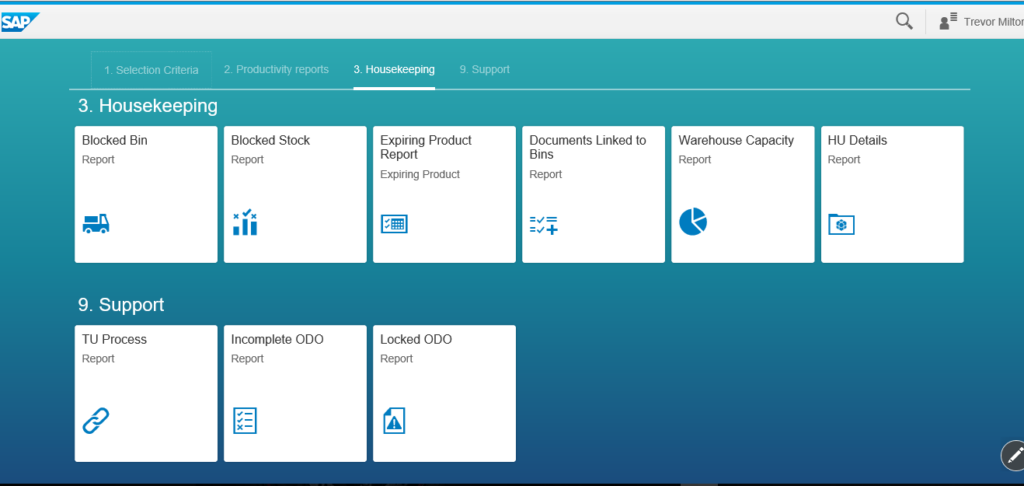
From the dashboard the reports are accessible:
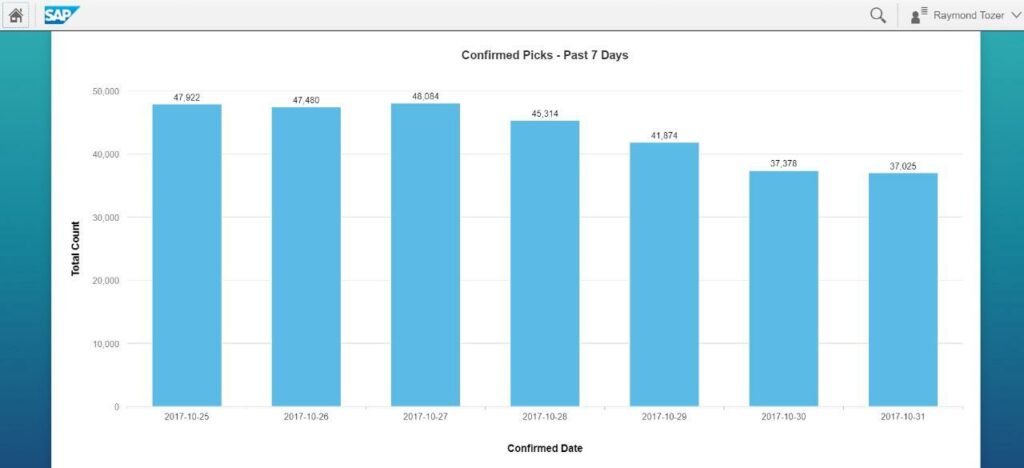
By selecting a specific day, the pick rate by hour was visible.
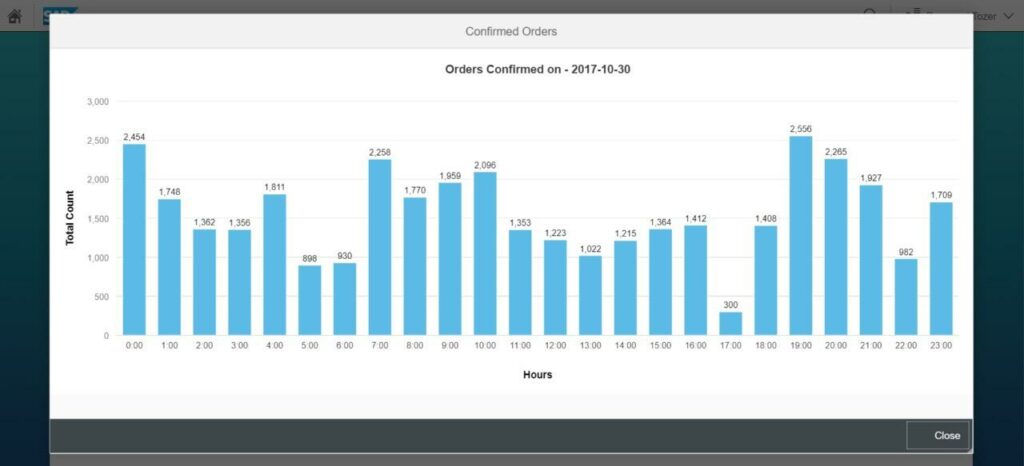
And this is where the proverbial Leopard showed its spots. It can clearly be seen from the hours in the day, exactly where the pick rate dwindled. Granted, some of these hours might be due to the shift changing or lunch breaks but the question remains: If the pick workforce is the same for the duration of the shift, why is the pick rate so erratic?
By going to the operation floor and investigating what was happening during these hours, it will became apparent that there is either stock availability, or resource efficiency issues during these times. These issues could then specifically be addressed.
In 5 days the warehouse could improve its efficiency by 20%.
- Real Data
- Real Information
- Effective Decisions
- Real Value
Fiori, being an application based format and WEB enabled technology, allows users to view and manipulate reports on their mobile phones or any browser of their choice.
The next bold step would be to integrate the execution of transactions and display the relevant information for those transactions on one Fiori dashboard. The dashboard is a process step diagram with all the steps and reports needed to complete a process.
Well after this article we can now officially add a few more counts to the use of the word Visibility, but the future is clear; the information is available, so let’s make it happen.
For more information, email info@argonscs.com.